Augmenting Semantic Lexicons Using Word Embeddings and Transfer Learning
September 18, 2021 by Thayer Alshaabi, Colin M. Van Oort, Mikaela Irene Fudolig, Michael V. Arnold, Christopher M. Danforth, and Peter Sheridan Dodds
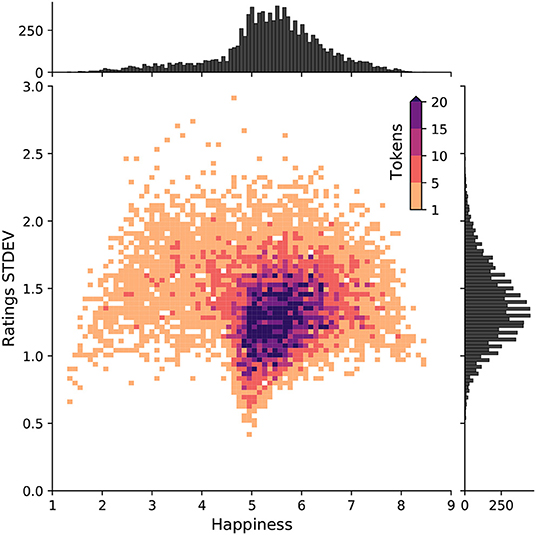
A 2D histogram of happiness and standard deviation of human ratings for each word in the labMT dataset.
Sentiment-aware intelligent systems are essential to a wide array of applications. These systems are driven by language models which broadly fall into two paradigms: Lexicon-based and contextual. Although recent contextual models are increasingly dominant, we still see demand for lexicon-based models because of their interpretability and ease of use. For example, lexicon-based models allow researchers to readily determine which words and phrases contribute most to a change in measured sentiment. A challenge for any lexicon-based approach is that the lexicon needs to be routinely expanded with new words and expressions. Here, we propose two models for automatic lexicon expansion. Our first model establishes a baseline employing a simple and shallow neural network initialized with pre-trained word embeddings using a non-contextual approach. Our second model improves upon our baseline, featuring a deep Transformer-based network that brings to bear word definitions to estimate their lexical polarity. Our evaluation shows that both models are able to score new words with a similar accuracy to reviewers from Amazon Mechanical Turk, but at a fraction of the cost.
The sleep loss insult of Spring Daylight Savings in the US is observable in Twitter activity
September 9, 2021 by Kelsey Linnell, Michael Arnold, Thayer Alshaabi, Thomas McAndrew, Jeanie Lim, Peter Sheridan Dodds, Christopher M Danforth
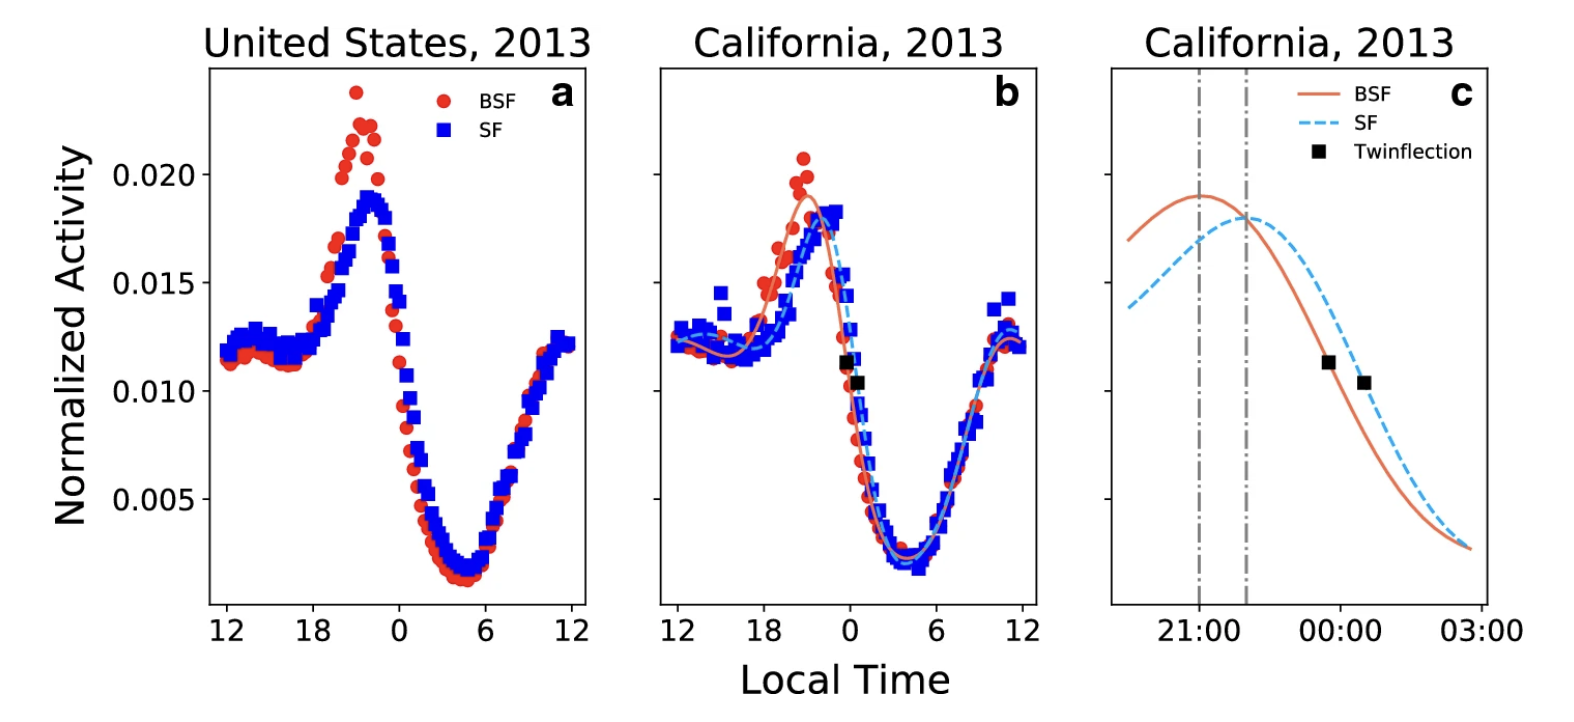
Twitter activity behavioral curves showing normalized counts of twitter activity before and after the spring daylight savings time shift.
Sleep loss has been linked to heart disease, diabetes, cancer, and an increase in accidents, all of which are among the leading causes of death in the United States. Population-scale sleep studies have the potential to advance public health by helping to identify at-risk populations, changes in collective sleep patterns, and to inform policy change. Prior research suggests other kinds of health indicators such as depression and obesity can be estimated using social media activity. However, the inability to effectively measure collective sleep with publicly available data has limited large-scale academic studies. Here, we investigate the passive estimation of sleep loss through a proxy analysis of Twitter activity profiles. We use “Spring Forward” events, which occur at the beginning of Daylight Savings Time in the United States, as a natural experimental condition to estimate spatial differences in sleep loss across the United States. On average, peak Twitter activity occurs 15 to 30 min later on the Sunday following Spring Forward. By Monday morning however, activity curves are realigned with the week before, suggesting that the window of sleep opportunity is compressed in Twitter data, revealing Spring Forward behavioral change.
Storywrangler: A massive exploratorium for sociolinguistic, cultural, socioeconomic, and political timelines using Twitter
July 25, 2020 by Thayer Alshaabi, Jane L. Adams, Michael V. Arnold, Joshua R. Minot, David R. Dewhurst, Andrew J. Reagan, Christopher M. Danforth, Peter Sheridan Dodds
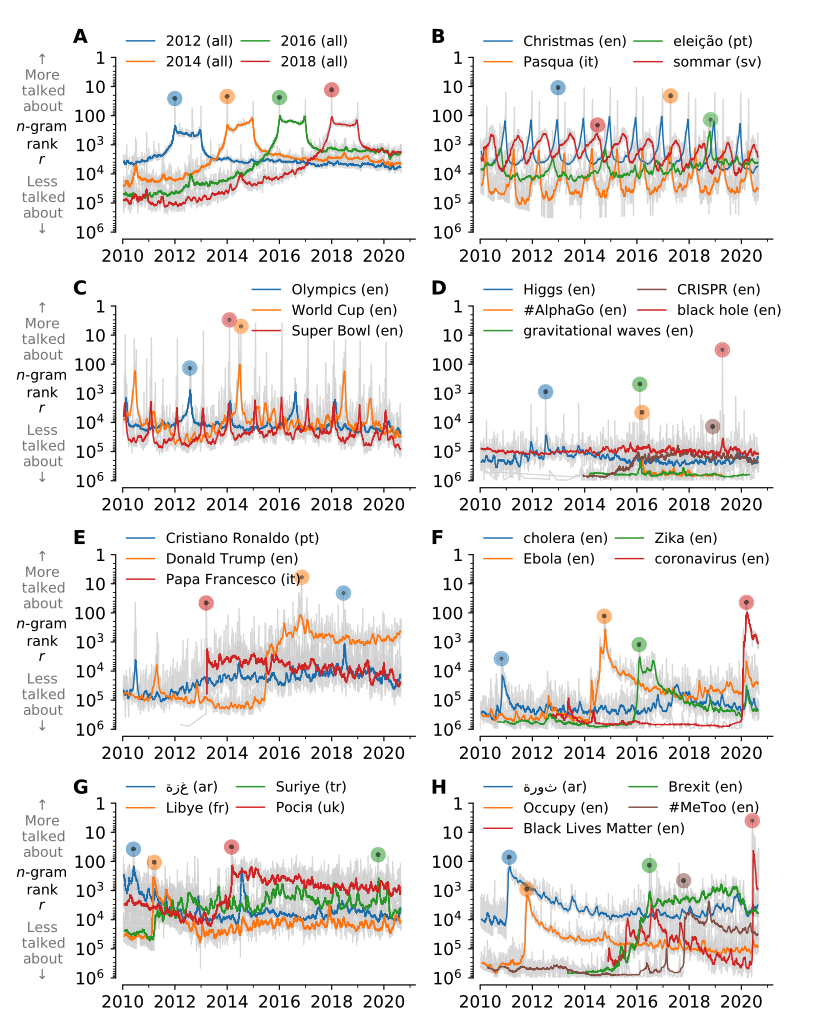
Thematically connected n-gram time series.
In real-time, social media data strongly imprints world events, popular culture, and day-to-day conversations by millions of ordinary people at a scale that is scarcely conventionalized and recorded. Vitally, and absent from many standard corpora such as books and news archives, sharing and commenting mechanisms are native to social media platforms, enabling us to quantify social amplification (i.e., popularity) of trending storylines and contemporary cultural phenomena. Here, we describe Storywrangler, a natural language processing instrument designed to carry out an ongoing, day-scale curation of over 100 billion tweets containing roughly 1 trillion 1-grams from 2008 to 2021. For each day, we break tweets into unigrams, bigrams, and trigrams spanning over 100 languages. We track n-gram usage frequencies, and generate Zipf distributions, for words, hashtags, handles, numerals, symbols, and emojis. We make the data set available through an interactive time series viewer, and as downloadable time series and daily distributions. Although Storywrangler leverages Twitter data, our method of extracting and tracking dynamic changes of n-grams can be extended to any similar social media platform. We showcase a few examples of the many possible avenues of study we aim to enable including how social amplification can be visualized through 'contagiograms'. We also present some example case studies that bridge n-gram time series with disparate data sources to explore sociotechnical dynamics of famous individuals, box office success, and social unrest.
Divergent modes of online collective attention to the COVID-19 pandemic are associated with future caseload variance
April 7, 2020 by David Rushing Dewhurst, Thayer Alshaabi, Michael V. Arnold, Joshua R. Minot, Christopher M. Danforth, Peter Sheridan Dodds
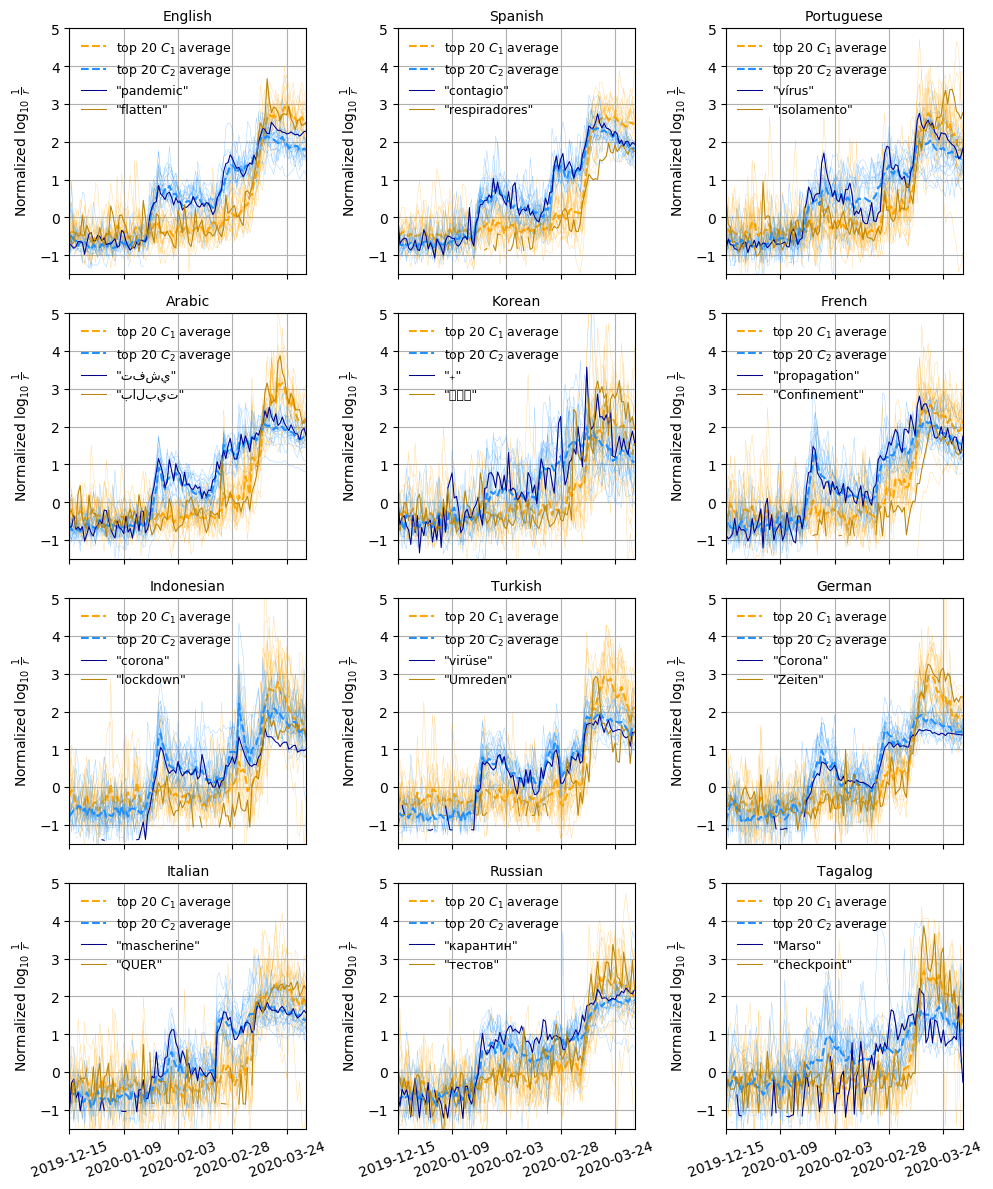
The mean normalized log rank timeseries of the top 20 words closest to each cluster centroid.
Using a random 10% sample of tweets authored from 2019-09-01 through 2020-03-25, we analyze the dynamic behavior of words (1-grams) used on Twitter to describe the ongoing COVID-19 pandemic. Across 24 languages, we find two distinct dynamic regimes: One characterizing the rise and subsequent collapse in collective attention to the initial Coronavirus outbreak in late January, and a second that represents March COVID-19-related discourse. Aggregating countries by dominant language use, we find that volatility in the first dynamic regime is associated with future volatility in new cases of COVID-19 roughly three weeks (average 22.7 pm 2.17 days) later. Our results suggest that surveillance of change in usage of epidemiology-related words on social media may be useful in forecasting later change in disease case numbers, but we emphasize that our current findings are not causal or necessarily predictive.
Hurricanes and hashtags: Characterizing online collective attention for natural disasters
March 31, 2020 by Michael V. Arnold, David Rushing Dewhurst, Thayer Alshaabi, Joshua R.Minot, Jane L. Adams, Christopher M. Danforth, Peter Sheridan Dodds
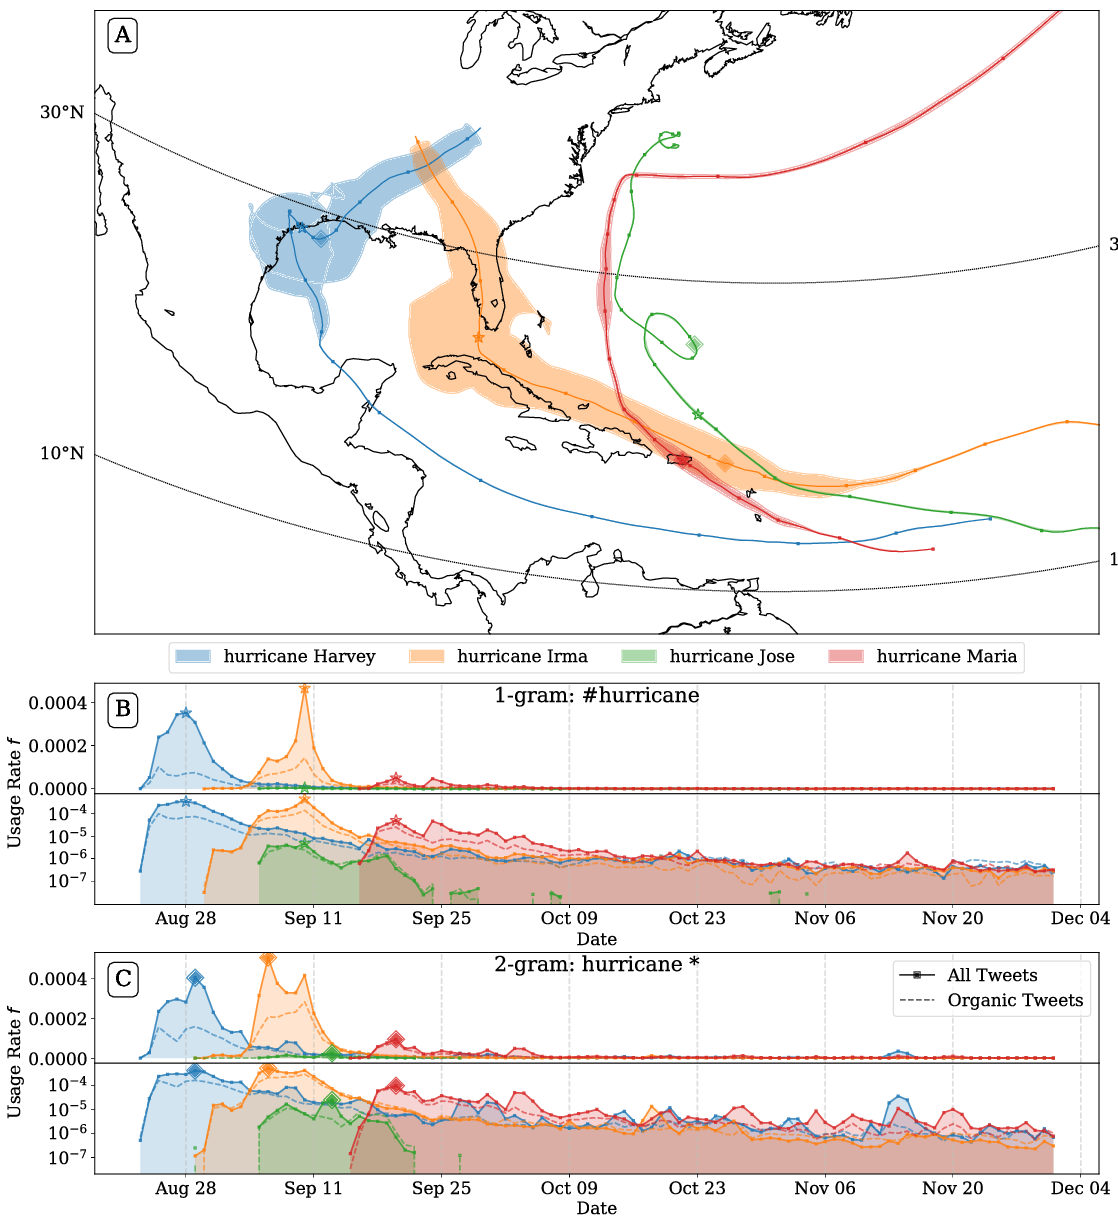
Hashtag attention map and usage rate time series for 1-grams matching the case-insensitive pattern ''#hurricane*'' for all four hurricanes reaching at least category 4 in the 2017 hurricane season.
We study collective attention paid towards hurricanes through the lens of $n$-grams on Twitter, a social media platform with global reach. Using hurricane name mentions as a proxy for awareness, we find that the exogenous temporal dynamics are remarkably similar across storms, but that overall collective attention varies widely even among storms causing comparable deaths and damage. We construct `hurricane attention maps' and observe that hurricanes causing deaths on (or economic damage to) the continental United States generate substantially more attention in English language tweets than those that do not. We find that a hurricane’s Saffir-Simpson wind scale category assignment is strongly associated with the amount of attention it receives. Higher category storms receive higher proportional increases of attention per proportional increases in number of deaths or dollars of damage, than lower category storms. The most damaging and deadly storms of the 2010s, Hurricanes Harvey and Maria, generated the most attention and were remembered the longest, respectively. On average, a category 5 storm receives 4.6 times more attention than a category 1 storm causing the same number of deaths and economic damage.
How the world's collective attention is being paid to a pandemic: COVID-19 related 1-gram time series for 24 languages on Twitter
March 27, 2020 by T. Alshaabi, J. R. Minot, M. V. Arnold, J. L. Adams, D. R. Dewhurst, A. J. Reagan, R. Muhamad, C. M. Danforth, P. S. Dodds
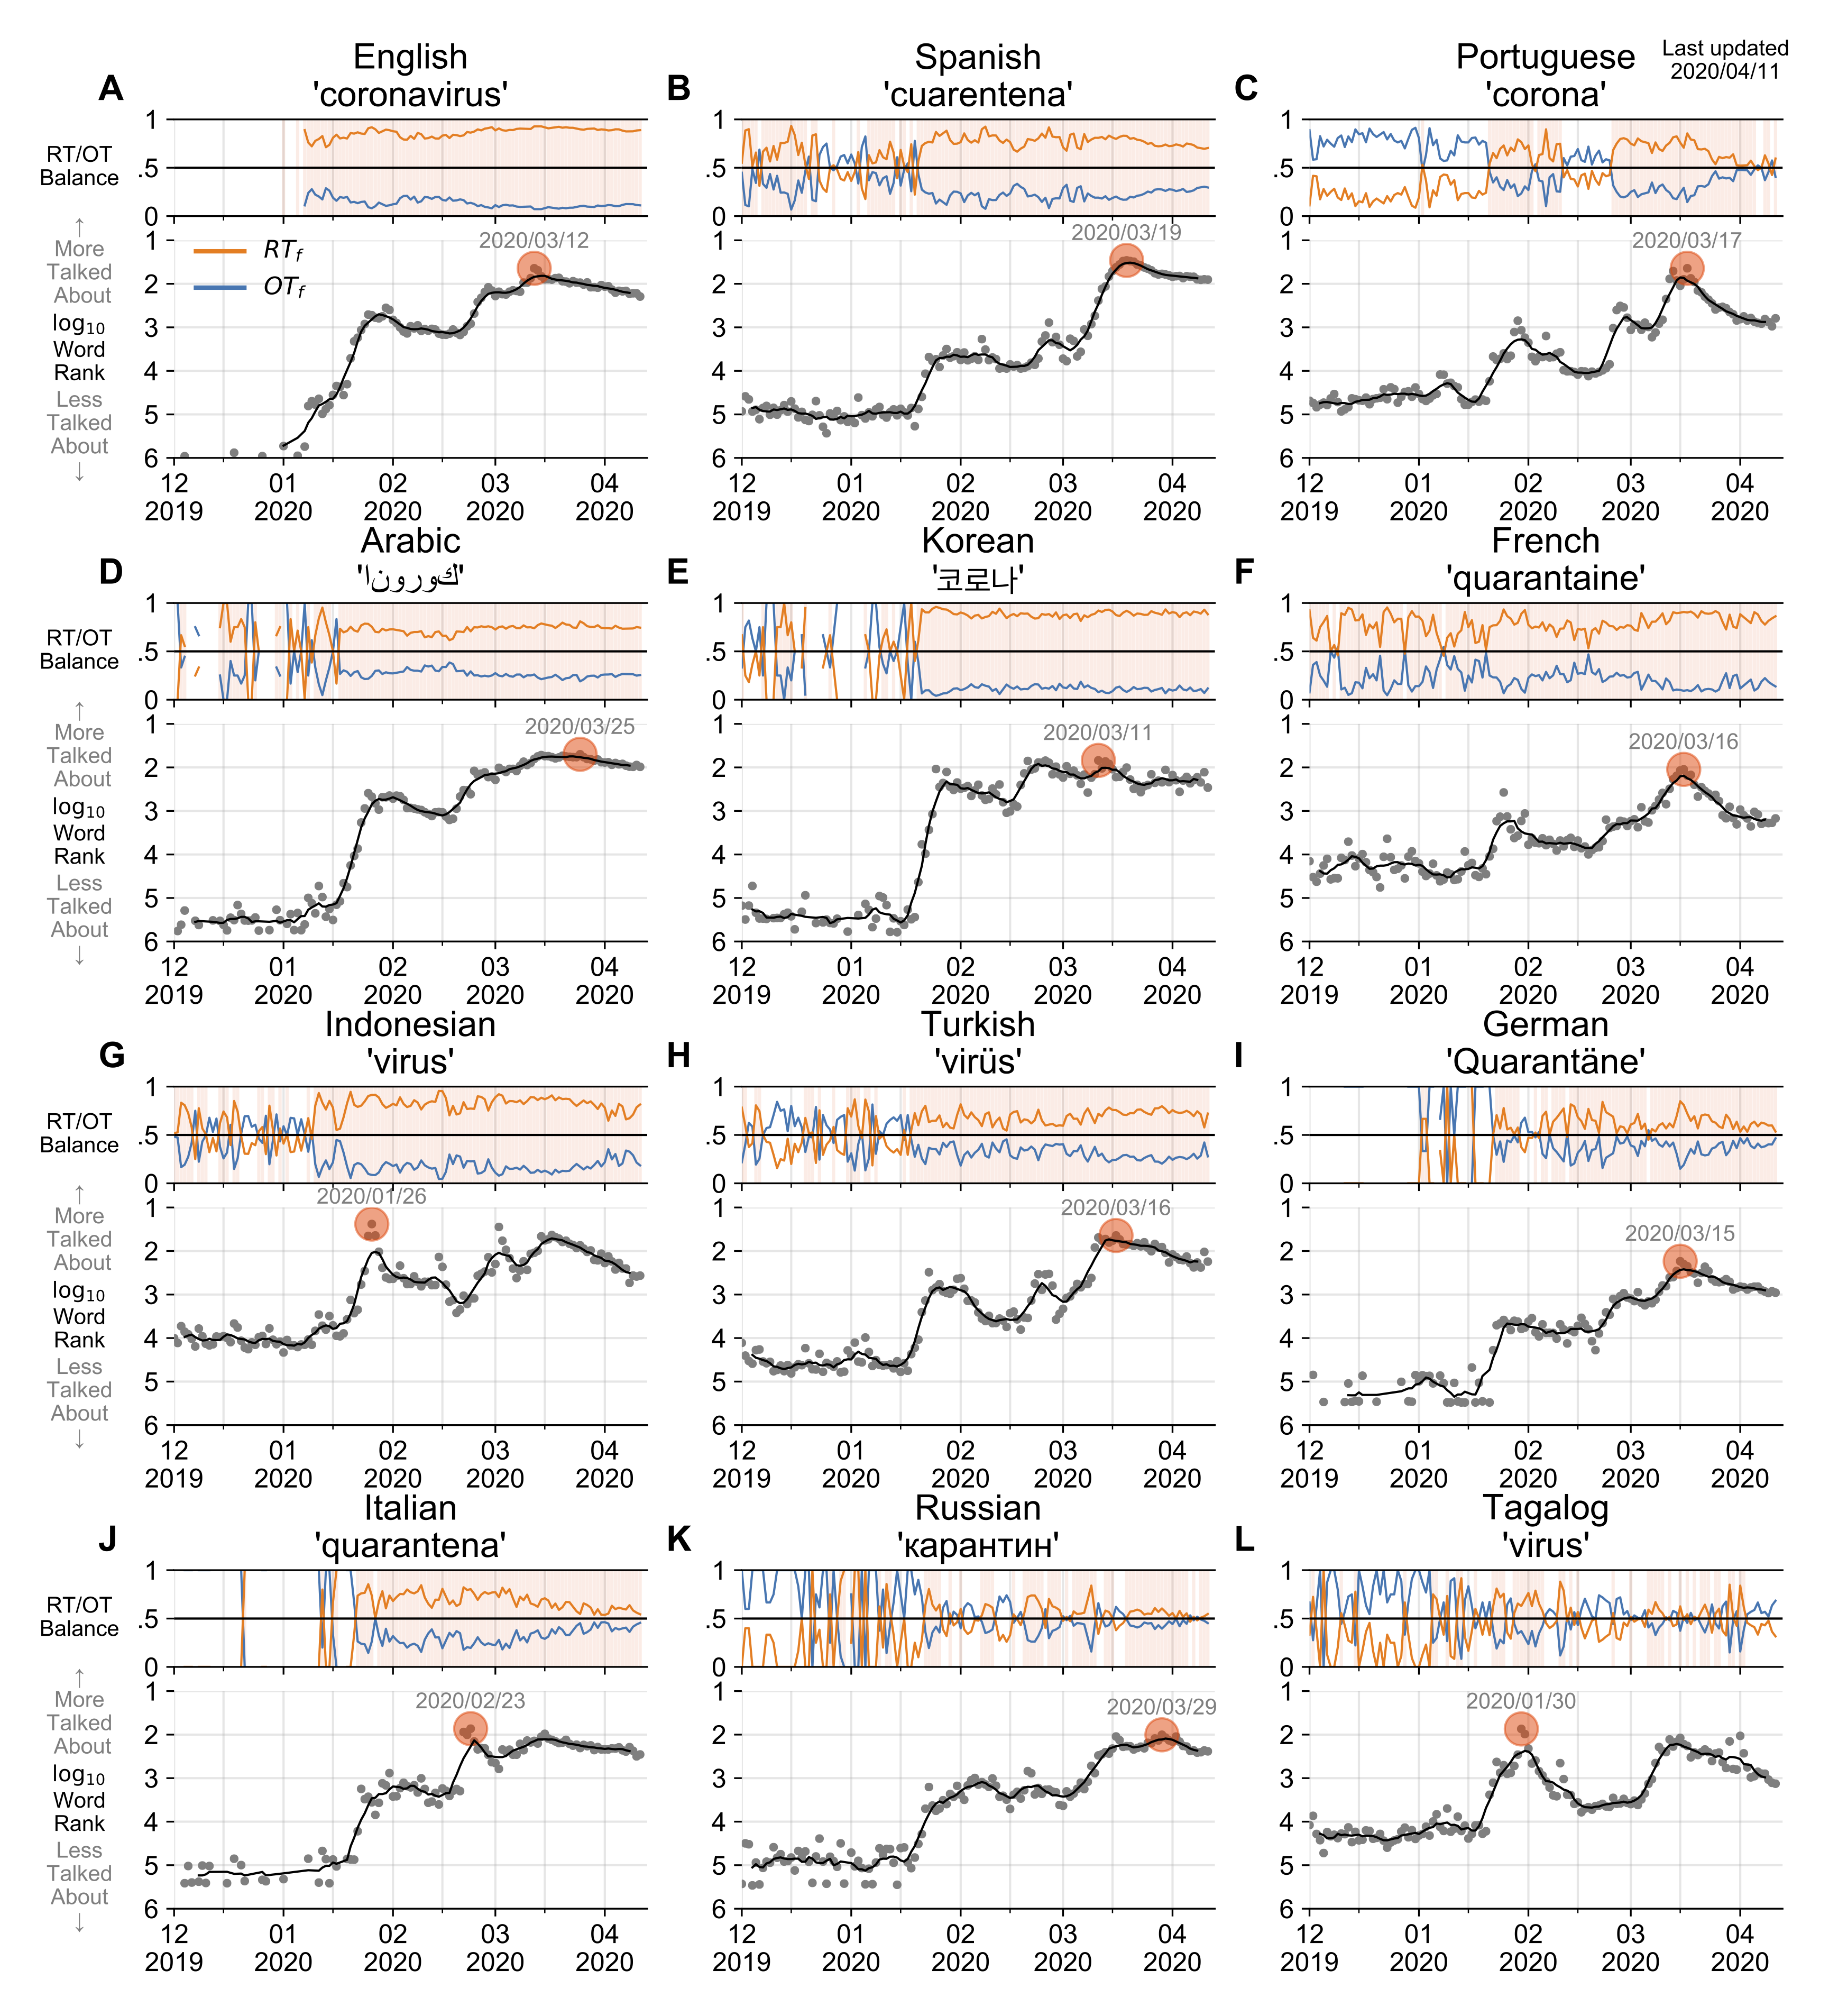
Usage rank time series for the word ‘coronavirus’ in the top 12 of the 24 languages we study here.
In confronting the global spread of the coronavirus disease COVID-19 pandemic we must have coordinated medical, operational, and political responses. In all efforts, data is crucial. Fundamentally, and in the possible absence of a vaccine for 12 to 18 months, we need universal, well-documented testing for both the presence of the disease as well as confirmed recovery through serological tests for antibodies, and we need to track major socioeconomic indices. But we also need auxiliary data of all kinds, including data related to how populations are talking about the unfolding pandemic through news and stories. To in part help on the social media side, we curate a set of 1000 day-scale time series of 1-grams across 24 languages on Twitter that are most `important' for March 2020 with respect to March 2019. We determine importance through our allotaxonometric instrument, rank-turbulence divergence. We make some basic observations about some of the time series, including a comparison to numbers of confirmed deaths due to COVID-19 over time. We broadly observe across all languages a peak for the language-specific word for `virus' in January followed by a decline through February and a recent surge through March. The world's collective attention dropped away while the virus spread out from China. We host the time series on Gitlab, updating them on a daily basis while relevant. Our main intent is for other researchers to use these time series to enhance whatever analyses that may be of use during the pandemic as well as for retrospective investigations.
The growing echo chamber of social media: Measuring temporal and social contagion dynamics for over 150 languages on Twitter for 2009--2020
March 7, 2020 by Thayer Alshaabi, David Rushing Dewhurst, Joshua R. Minot, Michael V. Arnold, Jane L. Adams, Christopher M. Danforth, Peter Sheridan Dodds
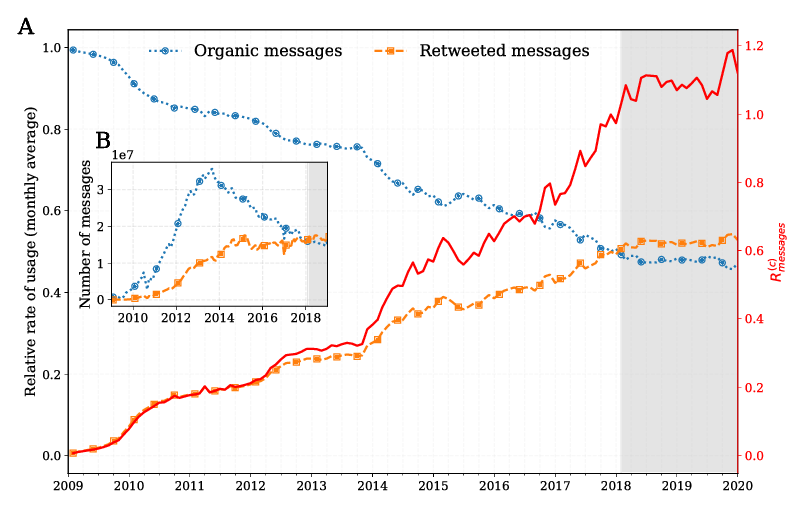
Figure 3 in paper: Timeseries for organic messages (blue), retweeted messages (orange), and average contagion ratio(red) for all languages.
Working from a dataset of 118 billion messages running from the start of 2009 to the end of 2019, we identify and explore the relative daily use of over 150 languages on Twitter. We find that eight languages comprise 80% of all tweets, with English, Japanese, Spanish, and Portuguese being the most dominant. To quantify each language's level of being a Twitter 'echo chamber' over time, we compute the 'contagion ratio': the balance of retweets to organic messages. We find that for the most common languages on Twitter there is a growing tendency, though not universal, to retweet rather than share new content. By the end of 2019, the contagion ratios for half of the top 30 languages, including English and Spanish, had reached above 1---the naive contagion threshold. In 2019, the top 5 languages with the highest average daily ratios were, in order, Thai (7.3), Hindi, Tamil, Urdu, and Catalan, while the bottom 5 were Russian, Swedish, Esperanto, Cebuano, and Finnish (0.26). Further, we show that over time, the contagion ratios for most common languages are growing more strongly than those of rare languages.
Allotaxonometry and rank-turbulence divergence: A universal instrument for comparing complex systems
February 22, 2020 by Peter Sheridan Dodds, Joshua R. Minot, Thayer Alshaabi, Michael V. Arnold, Jane Lydia Adams, David Rushing Dewhurst, Tyler J. Gray, Morgan R Frank, Andrew J. Reagan, Christopher M. Danforth
An example allotaxonomic ‘rank-rank histogram’ comparing word usage ranks on two days of Twitter.
Complex systems often comprise many kinds of components which vary over many orders of magnitude in size: Populations of cities in countries, individual and corporate wealth in economies, species abundance in ecologies, word frequency in natural language, and node degree in complex networks. Comparisons of component size distributions for two complex systems---or a system with itself at two different time points---generally employ information-theoretic instruments, such as Jensen-Shannon divergence. We argue that these methods lack transparency and adjustability, and should not be applied when component probabilities are non-sensible or are problematic to estimate. Here, we introduce `allotaxonometry' along with `rank-turbulence divergence', a tunable instrument for comparing any two (Zipfian) ranked lists of components. We analytically develop our rank-based divergence in a series of steps, and then establish a rank-based allotaxonograph which pairs a map-like histogram for rank-rank pairs with an ordered list of components according to divergence contribution. We explore the performance of rank-turbulence divergence for a series of distinct settings including: Language use on Twitter and in books, species abundance, baby name popularity, market capitalization, performance in sports, mortality causes, and job titles. We provide a series of supplementary flipbooks which demonstrate the tunability and storytelling power of rank-based allotaxonometry.
Fame and Ultrafame: Measuring and comparing daily levels of `being talked about' for United States' presidents, their rivals, God, countries, and K-pop
September 30, 2019 by Peter Sheridan Dodds, Joshua R. Minot, Michael V. Arnold, Thayer Alshaabi, Jane Lydia Adams, David Rushing Dewhurst, Andrew J. Reagan, Christopher M. Danforth
Figure 2 in publication. Temporal Lexical Fame on Twitter at day resolution, click image for more details.
When building a global brand of any kind---a political actor, clothing style, or belief system---developing widespread awareness is a primary goal. Short of knowing any of the stories or products of a brand, being talked about in whatever fashion---raw fame---is, as Oscar Wilde would have it, better than not being talked about at all. Here, we measure, examine, and contrast the day-to-day raw fame dynamics on Twitter for U.S. Presidents and major U.S. Presidential candidates from 2008 to 2019: Barack Obama, John McCain, Mitt Romney, Hillary Clinton, and Donald Trump. We assign ``lexical fame'' to be the number and (Zipfian) rank of the (lowercased) mentions made for each individual across all languages. We show that all five political figures have at some point reached extraordinary volume levels of what we define to be ``lexical ultrafame'': An overall rank of approximately 300 or less which is largely the realm of function words and demarcated by the highly stable rank of `god'. By this measure, `trump' has become enduringly ultrafamous, from the 2016 election on. We use typical ranks for country names and function words as standards to improve perception of scale. We quantify relative fame rates and find that in the eight weeks leading up the 2008 and 2012 elections, `obama' held a 1000:757 volume ratio over `mccain' and 1000:892 over `romney', well short of the 1000:544 volume favoring `trump' over `hillary' in the 8 weeks leading up to the 2016 election. Finally, we track how one other entity has more sustained ultrafame than `trump' on Twitter: The Korean pop boy band BTS. We chart the dramatic rise of BTS, finding their Twitter handle `@bts\_twt' has been able to compete with `a' and `the', reaching a rank of three at the day scale and a rank of one at the quarter-hour scale.
The shocklet transform: A decomposition method for the identification of local, mechanism-driven dynamics in sociotechnical time series
June 27, 2019 by David Rushing Dewhurst, Thayer Alshaabi, Dilan Kiley, Michael V. Arnold, Joshua R. Minot, Christopher M. Danforth, Peter Sheridan Dodds
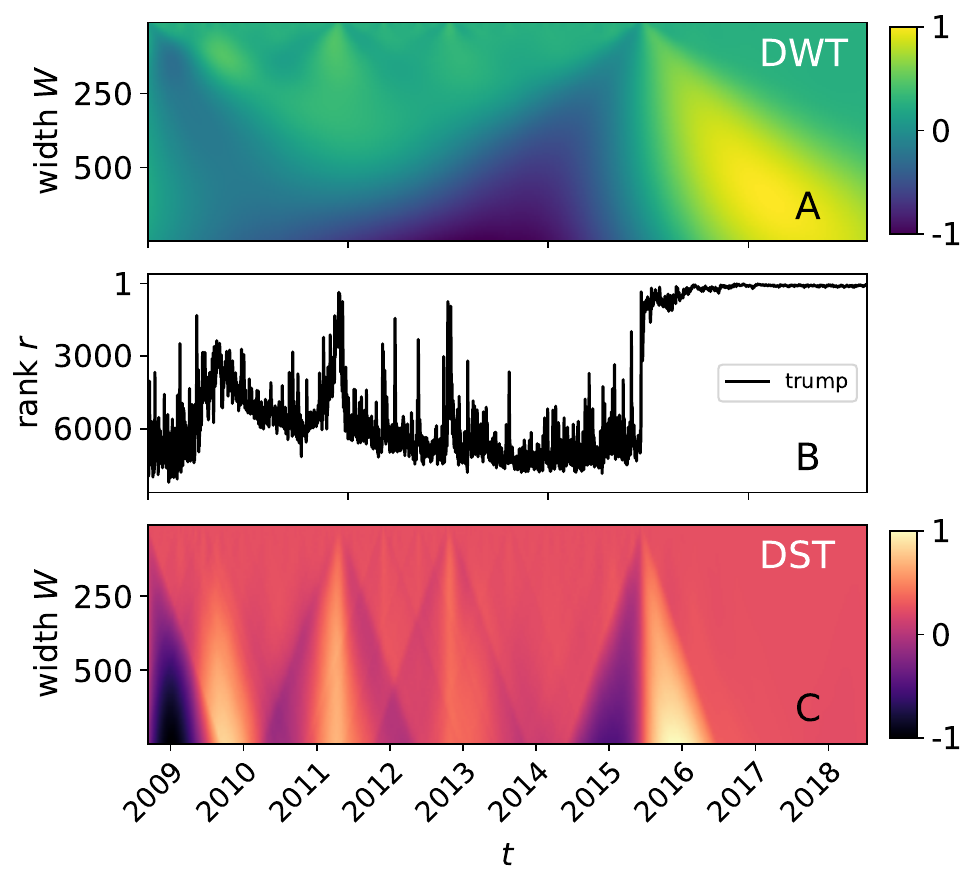
Figure 3 in publication. Comparison between the decrete wavelet transform (DWT) and the decrete shocklet transform (DST), click image for more details.
We introduce an unsupervised pattern recognition algorithm termed the Discrete Shocklet Transform (DST) by which local dynamics of time series can be extracted. Time series that are hypothesized to be generated by underlying deterministic mechanisms have significantly different DSTs than do purely random null models. We apply the DST to a sociotechnical data source, usage frequencies for a subset of words on Twitter over a decade, and demonstrate the ability of the DST to filter high-dimensional data and automate the extraction of anomalous behavior.
Selection mechanisms affect volatility in evolving markets
December 13, 2018 by David Rushing Dewhurst, Michael Vincent Arnold, Colin Michael Van Oort.
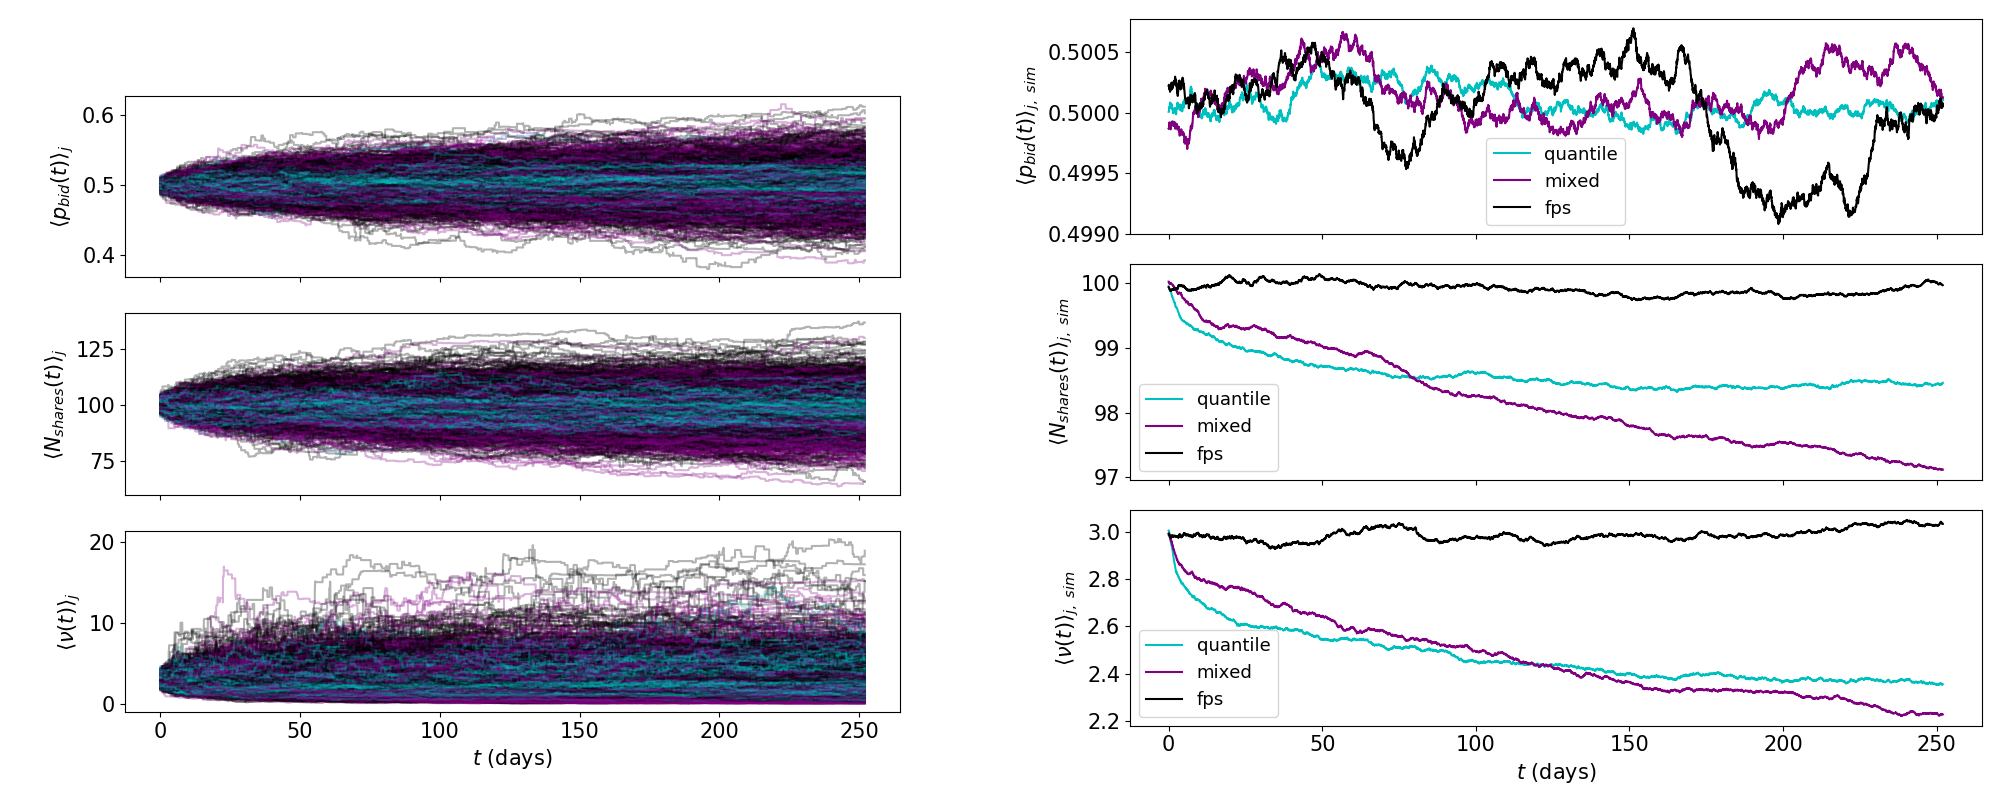
Figure 2 in publication. Agent parameter timeseries by selection mechanism, click image for more details.
Financial asset markets are sociotechnical systems whose constituent agents are subject to evolutionary pressure as unprofitable agents exit the marketplace and more profitable agents continue to trade assets. Using a population of evolving zero-intelligence agents and a frequent batch auction price-discovery mechanism as substrate, we analyze the role played by evolutionary selection mechanisms in determining macro-observable market statistics. In particular, we show that selection mechanisms incorporating a local fitness-proportionate component are associated with high correlation between a micro, risk-aversion parameter and a commonly-used macro-volatility statistic, while a purely quantile-based selection mechanism shows significantly less correlation.
 This work is licensed under a
Creative Commons Attribution-NonCommercial-NoDerivatives 4.0 International License.
This work is licensed under a
Creative Commons Attribution-NonCommercial-NoDerivatives 4.0 International License.